
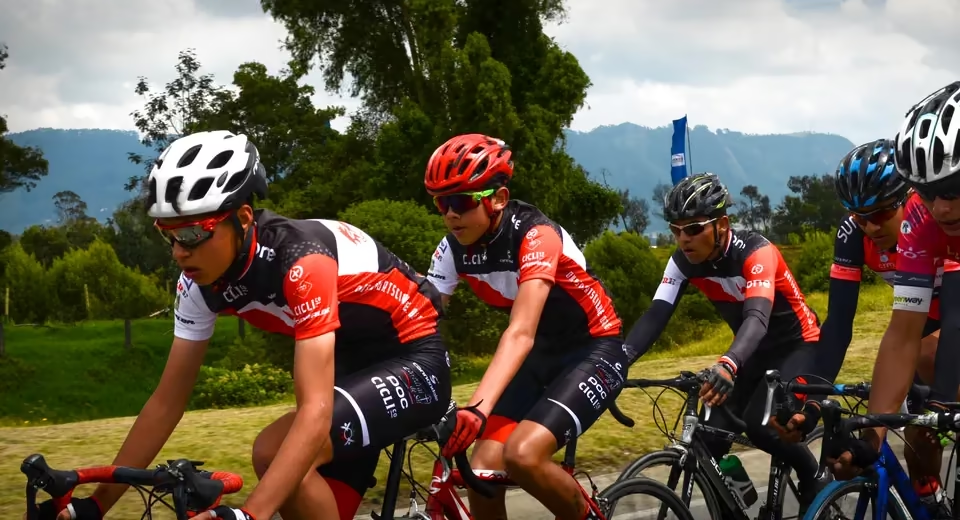
Group of cyclists climbing at altitude near Bogotá

Summary

Performance at altitude

Free calculator · Training and load

How much FTP you lose going up to Bogotá or a high pass, how much acclimatisation gives back, and why the fitter rider loses more.

What you need
Your FTP at the altitude you usually train at, the altitude you will race at, and the days you will spend there before the event.
What it gives you

How much power the altitude you are heading to costs, against your own FTP.

How much acclimatisation gives back, and over how many days.

Why the fitter cyclist loses more, which is the opposite of what most people expect.

What it does not do

These are population models. The individual response to altitude varies enormously and cannot be predicted in advance: this is for planning your margin, not for fixing the watts of the day.

5.0 on Google from 60 public reviews, verifiable on the laboratory listing.
All calculators

Free tool

Altitude performance calculator

How much power you lose going up, and how much you get back coming down. It is built around the specific case of the Bogotá plateau — 2,600 m — and for anyone arriving from sea level or heading away to race. These are illustrative scenarios: training status alone does not predict your individual response.

It runs in your browser. Nothing is sent, nothing is stored and no sign-up is needed. If you use the buttons below the calculator, the message is written here and opens in your own app: you decide whether to send it.

Calculator

Your starting point

Choose a scenario to explore sensitivity. W/kg, age and race category do not measure maximal oxygen uptake or altitude susceptibility.

How it changes with altitude

Estimated power at different altitudes
AltitudeEstimated FTPLoss

What you need to know about these figures

    Take the result with you

    Send us this calculation and we will tell you what to do with it.

    The button writes the message for you: what you entered, what came out and the name of the tool. It opens in your own app, already written, and you decide whether to send it. Nothing leaves this page until you do.

    Your message opens ready to edit. Nothing is sent automatically.

    Method and sources

    References · 10 primary sourcesView the full citationsWehrlin and Hallén 2006 · Clark et al. 2007 · Gore et al. 1996 · Mollard et al. 2007 · Schuler et al. 2007 · Guenette et al. 2004 · Brutsaert et al. 2019 · Böning et al. 2010 · Levine and Stray-Gundersen 1997 · Millet et al. 2010

    Primary sources and position statements the method on this page relies on.

    1. Wehrlin, J. P. and Hallén, J. (2006). Linear decrease in VO2max and performance with increasing altitude in endurance athletes. European Journal of Applied Physiology.
    2. Clark, S. A. et al. (2007). The effect of acute simulated moderate altitude on power, performance and pacing strategies in well-trained cyclists. European Journal of Applied Physiology.
    3. Gore, C. J. et al. (1996). Increased arterial desaturation in trained cyclists during maximal exercise at 580 m altitude. Journal of Applied Physiology.
    4. Mollard, P. et al. (2007). Role of maximal heart rate and arterial O2 saturation on the decrement of VO2max in moderate acute hypoxia in trained and untrained men. International Journal of Sports Medicine.
    5. Schuler, B., Thomsen, J. J., Gassmann, M. and Lundby, C. (2007). Timing the arrival at 2340 m altitude for aerobic performance. Scandinavian Journal of Medicine & Science in Sports.
    6. Guenette, J. A. et al. (2004). Acute hypoxic ventilatory response and exercise-induced arterial hypoxemia in men and women. Respiratory Physiology & Neurobiology.
    7. Brutsaert, T. D. et al. (2019). Association of EGLN1 gene with high aerobic capacity of Peruvian Quechua at high altitude. Proceedings of the National Academy of Sciences.
    8. Böning, D. et al. (2010). Limiting factors of maximal oxygen uptake at altitude. High Altitude Medicine & Biology.
    9. Levine, B. D. and Stray-Gundersen, J. (1997). “Living high-training low”: effect of moderate-altitude acclimatization with low-altitude training on performance. Journal of Applied Physiology.
    10. Millet, G. P., Roels, B., Schmitt, L., Woorons, X. and Richalet, J. P. (2010). Combining hypoxic methods for peak performance. Sports Medicine.
    Aerobic power starts to fall far lower down than most people think. In trained endurance athletes, Wehrlin and Hallén (2006) measured in a hypobaric chamber that maximal oxygen uptake already drops between 300 and 800 m, and from there falls roughly linearly: 6.3 % per 1,000 m. In well-trained, unacclimatised cyclists, Clark and colleagues (2007) saw mean power in a 5 min time trial fall by 5.8, 10.3 and 19.8 % at 1,200, 2,200 and 3,200 m.

    This calculator applies 6.1 % per 1,000 m, the slope that sums up those three figures, starting at 300 m if you are trained, 600 m if you are an amateur and 1,000 m if you ride recreationally. There is a leap worth knowing about: those studies measure maximal efforts lasting a few minutes, and here they are applied to your FTP. There is no equivalent data for an hour, so treat the figure as an order of magnitude.

    Why the fitter rider may suffer more

    Gore and colleagues (1996) took trained and untrained cyclists to a simulated altitude of just 580 m. Maximal oxygen uptake fell by 6.8 % on average in the trained group and did not change significantly in the untrained one. The explanation is that a very capable cardiovascular system is already working close to the pulmonary diffusion limit at sea level, and when oxygen pressure falls the blood leaves the lungs less saturated.

    Not every study confirms it. Mollard and colleagues (2007) found no difference in the relative drop between trained and untrained men from 1,000 to 4,500 m. That is why the calculator uses the same slope for everyone and only brings forward the altitude at which the drop starts the fitter you are. In practice: if you arrive from elsewhere with 5 W/kg, you will probably feel the difference on the plateau a little more than your 3 W/kg riding partner. It is not a lack of form.

    What acclimatisation gives back, and what it does not

    The first hours and days are the worst. Between the first and third week part of the performance comes back — ventilation increases, bicarbonate handling improves, plasma volume adjusts — but it isnot fully recovered. Schuler and colleagues (2007) followed eight elite cyclists at 2,340 m: maximal oxygen uptake fell by 12.8 % on the first day, recovered about a fifth of that loss in the first week, just over half by two weeks and about three fifths by three, when it was no longer improving significantly. This calculator applies those proportions: a fifth after a week and three fifths from three weeks. Living at 2,600 m does not give you back the threshold you had at sea level; it brings you closer, and no more recovery is assumed here than those three weeks provide.

    That acclimatisation is not erased by moving. The altitude where you live is always read as a resident's, and the days you declare apply only to whatever the destination has above your own altitude: if you live at 3,000 m and are going to ride at 2,600 m, you are not meeting new altitude, you are coming down inside what you have already adapted to. It is a way of splitting acclimatisation across two stretches, not a validated model of anyone's exposure history: someone who has spent months alternating altitudes is outside what this represents.

    Why it does not ask for your sex

    Because there is no coefficient to apply. Guenette and colleagues (2004) measured oxygen saturation during maximal exercise in trained and untrained cyclists of both sexes: trained men fell to 91.4 % and trained women to 91.3 %, with no meaningful difference. What separated the groups was training, not sex. Asking here would give an appearance of precision the evidence does not support; where it does change the calculation — body composition — it is asked for.

    Where it stops working

    • The spread between people is wide. These figures are an extrapolation from group averages, not a prediction for you: the studies they come from measured efforts of a few minutes in small groups. Some lose considerably less than the estimate and some lose considerably more.
    • It only models the aerobic effect. Very short, explosive efforts are affected far less. Their power barely changes, and the speed they produce can improve because of the lower air resistance.
    • Thinner air gives something back. On the flat and downhill, the same power gives more speed. That is why on a climb the loss shows in full and on a flat time trial it is partly compensated.See that effect on the Alto de Patios →
    • Coming down does not guarantee a performance boost.The response depends on exposure, recovery and individual adaptation. This tool does not predict a peak-performance window.
    Group of cyclists climbing at altitude near Bogotá

    When the formula is no longer enough

    Your real loss is measured, not estimated.

    The spread between individuals is wide: two cyclists with the same threshold at sea level can lose very different percentages at the same altitude. A threshold test done here is worth more than any formula, and it is what lets you anchor the zones you actually train in.

    See the performance assessment
    ONEPERFORMANCE FINDER
    Your next step starts here