
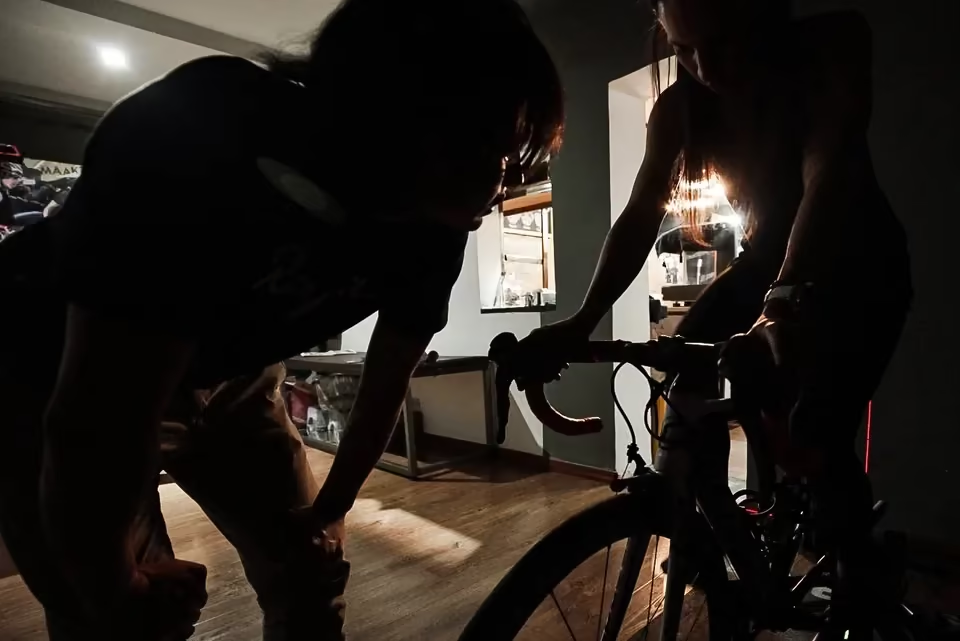
Cyclist pedalling under load during a session in the lab

Summary

Sweat rate

Free calculator · Nutrition and body composition

Weigh yourself before and after a ride to get your sweat per hour, and how much to drink next time without losing over 2 % of your weight or overdrinking.

What you need
A scale, a ride of at least one hour in conditions similar to your goal and four numbers written down: your weight before and after, naked and dry, what you drank and how long the ride lasted.
What it gives you

Your sweat rate in millilitres per hour, with the margin your scale allows.

How much weight you lost during the test, as a percentage.

How much to drink per hour on your next ride: the floor that keeps you within the margin and the ceiling that stops you overdrinking.

5.0 on Google from 66 public reviews, verifiable on the laboratory listing.
All calculators

Free tool

Sweat rate calculator for cycling

Weigh yourself before and after a ride, write down what you drank, and the scale tells you how much you sweat per hour in those conditions. With that figure, the calculator turns your next ride into a drinking range: the floor that keeps you within the weight-loss margin you choose, and the ceiling above which you would be drinking too much.

It runs in your browser. Nothing is sent, nothing is stored and no sign-up is needed. If you use the buttons below the calculator, the message is written here and opens in your own app: you decide whether to send it.

Calculator

The test

Naked, dry and after using the toilet.

Naked and dry: sweat left in your clothes or on your skin counts as weight you did not lose.

The weight of gels and bars, without the wrapper. That weight counts too.

If you stopped to urinate and did not measure it, leave an estimate and keep it in mind when reading the result.

Your next ride

In conditions similar to the test: same heat, same intensity, same altitude.

Your sweat rate

Your result, broken down

Breakdown of the sweat rate calculation
WhatFigureWhat it means

What to know about this figure

    Take the result with you

    Send us this calculation and we will tell you what to do with it.

    The button writes the message for you: what you entered, what came out and the name of the tool. It opens in your own app, already written, and you decide whether to send it. Nothing leaves this page until you do.

    Your message opens ready to edit. Nothing is sent automatically.

    What it takes into account and sources

    References · 2 primary sourcesView the full citationsSawka et al. 2007 · Thomas et al. 2016

    Primary sources and position statements the method on this page relies on.

    1. Sawka, M. N. et al. (2007). American College of Sports Medicine position stand: exercise and fluid replacement. Medicine & Science in Sports & Exercise.
    2. Thomas, D. T., Erdman, K. A. and Burke, L. M. (2016). Position of the Academy of Nutrition and Dietetics, Dietitians of Canada and the American College of Sports Medicine: nutrition and athletic performance. Journal of the Academy of Nutrition and Dietetics.
    What it takes into account

    This is the body mass method proposed by the American College of Sports Medicine position stand on exercise and fluid replacement (Sawka and colleagues, 2007). Apart from urine, almost all the weight you lose during the ride leaves as sweat. What moves the result:

    • Your two weighings. Naked and dry, before and after. The weight you lost is most of the answer.
    • What went in and what left by another route. What you drank and ate during the ride counts in your favour; urine counts against.
    • How long the ride lasted. It turns the total into a rate per hour.
    • Your scale’s increments. Every weighing is rounded, and on a short ride that rounding weighs more. That is why the ride should last at least an hour and the scale should always be the same one.

    From the rate to the next ride

    That position stand sets two conditions: weight loss from water deficit stays under 2 %, and you never drink more than you sweat. The calculator turns them into a range:

    • Floor: what you need to drink so you do not lose more than the margin you choose. A narrower margin raises the floor, never the ceiling.
    • Ceiling: your own sweat rate. Drinking above it makes you gain weight during the ride, which is the situation that leads to hyponatraemia.

    When it is worth measuring

    • It only holds for the conditions of the test. With different heat, intensity or altitude the rate changes, sometimes a lot. The right thing is to repeat the test in cool and in hot weather, at altitude and lower down, on the flat and on a long climb.
    • Not all the weight lost is sweat. Some leaves with your breath and some is the fuel you burned. Next to sweat they are usually small; they count for more in cold or dry air, at altitude, and when you sweat little. Then the figure somewhat overestimates sweat.
    • It does not measure sodium. Two people with the same rate can lose very different amounts of sodium. Sweat concentration is a separate measurement.
    • It is not medical advice. With kidney or heart disease, or medication that affects fluid balance, the plan comes from your doctor.

    If drinking is already sorted and performance still drops on long rides, the limiting factor is somewhere else, and a performance assessment looks for it in your power files. See the performance assessment →

    Cyclist pedalling under load during a session in the lab

    When an estimate is no longer enough

    Sweat is measured with a scale. What holds you back, with your data.

    If drinking is already sorted and performance still drops on long rides, the limiting factor is somewhere else: the pace of the first hour, the week’s load or what you eat. An assessment looks for it in your power files.

    See the performance assessment
    ONEPERFORMANCE FINDER
    Your next step starts here